Console debug

Written by Lucy Fairhurst
Updated at January 4th, 2023


Table of Contents
What is the developer console?
The dev console is a tool to allow developers to inspect, edit and debug code that is built into most browsers. The following instructions are for ChromeDev Tools but the same applies to Safari and Firefox alike (though steps may differ).
How to open ChromeDev Tools?
- From your website page in question, right-click/secondary click to open menu. Do not refresh the page before you do this.
- Click 'Inspect', this will open your developer console (figure 1)
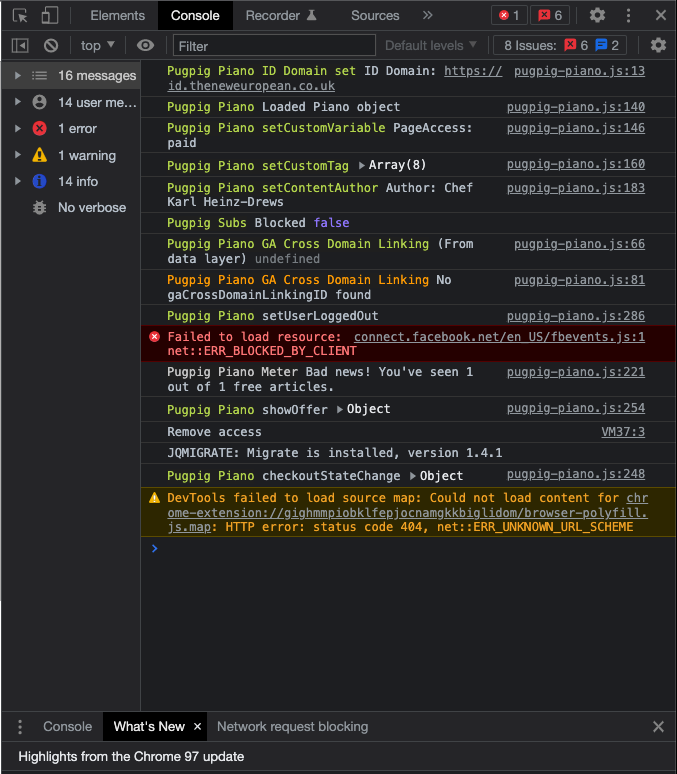
- Select the 'Console' tab, and you may see a list of messages/warnings/errors (figure 2)
- Screenshot this tab
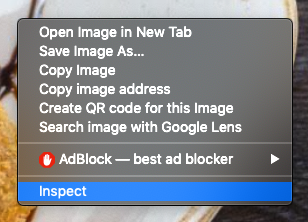 Figure 1