Pugpig Enterprise Performance Dashboard
Table of Contents
The Pugpig Enterprise Performance Dashboard is an Enterprise tool used to monitor the health of Pugpig's publishing platforms, how content flows through our platforms and how efficient we are at processing that content. We use server events to track how and when content moves through Pugpig's Express and Distribution Service to gain a full picture of the content lifecycle. The Pugpig Performance Dashboard is available to Enterprise customers and is accessible via Mixpanel.
The dashboard is split into three key sections that allow us to:
- Monitor the end-to-end health of our publishing platforms
- Measure the performance of our RSS feeds
- Follow the lifecycle of an individual article
How to use the Pugpig Performance Dashboard
Your Customer Success Manager will need the email addresses of each member of your team who you would like to have access to your Pugpig Performance Dashboard. You'll then be invited to join your Team in Mixpanel.
The Pugpig Performance Dashboard is stored in the ‘Pugpig Performance Project’ in Mixpanel. Every Team has access to their own specific Data View (a filtered view in Mixpanel that gives you access to the data recorded by your apps).
Navigate to the Boards area in Mixpanel to locate your company's Pugpig Performance Dashboard.

Lifecycle stages
The table below contains a list of all of the lifecycle stages monitored by the Pugpig Performance Dashboard.
There are two events sent to Mixpanel ‘article_lifecycle’ and ‘feedwordpress_lifecycle’ which can be broken down to provide greater granularity using the ‘Lifecycle stage’ property in Mixpanel. The table also indicates which Pugpig Service sends each event (Express or Distribution).
| Event name | Lifecycle stage | Service | Definition |
|---|---|---|---|
| article_lifecycle | page_processed |
Distribution | An article is processed by Distribution |
| article_lifecycle | edition_processed |
Distribution | An edition is processed by Distribution |
| article_lifecycle | feed_started |
Distribution | A feed starts to update in Distribution |
| article_lifecycle | feed_completed | Distribution | A feed finishes updating in Distribution |
| article_lifecycle | feed_queued | Distribution | A feed is added to the update queue |
| article_lifecycle | feed_aborted | Distribution | A feed update is aborted |
| article_lifecycle | post_created | Express | An article is published in Express |
| article_lifecycle | post_updated | Express | An article is updated in Express |
| article_lifecycle | edition_post_created | Express | An edition is published in Express |
| article_lifecycle | edition_post_updated | Express | An edition is updated in Express |
| feedwordpress_lifecycle | feed_poll_started | Express | Marks the start of a single feed poll |
| feedwordpress_lifcycle | feed_poll_completed | Express | Marks the end of a single feed poll |
| feedwordpress_lifecycle | updated_started | Express | Marks the start of a series of feed updates |
| feedwordpress_lifecycle | update_completed | Express | Marks the end of a series of feed updates |
Monitor how frequently feeds are updating
The ‘Time between stages of the content journey' section provides insight into the duration between feed updates across all feeds and at an individual feed level.
The ‘Median time between feed poll starting over time’ measure the median duration between each feed being polled (across all feeds). Whereas the ‘Distribution of time between feed poll starts’ measures the spread of time between feeds being updated (across all feeds).Both of these charts can be filtered by the ‘feed_uri’ property to narrow the data down to a specific feed.
Alternatively you can use the ‘Median time between feed poll started events broken down by feed URI’ chart to see the median polling duration for each of your feeds.
Track the lifecycle of an article
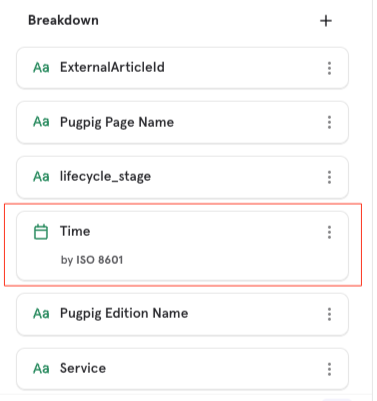
Filter the chart on publication and either use the Pugpig Page Name or ExternalArticleID property to follow the journey that a single article has taken through Pugpig's platforms.

Ensure that the Time property is broken down by ISO 8601 rather than by day to allow you to see the timestamp of each event.


